
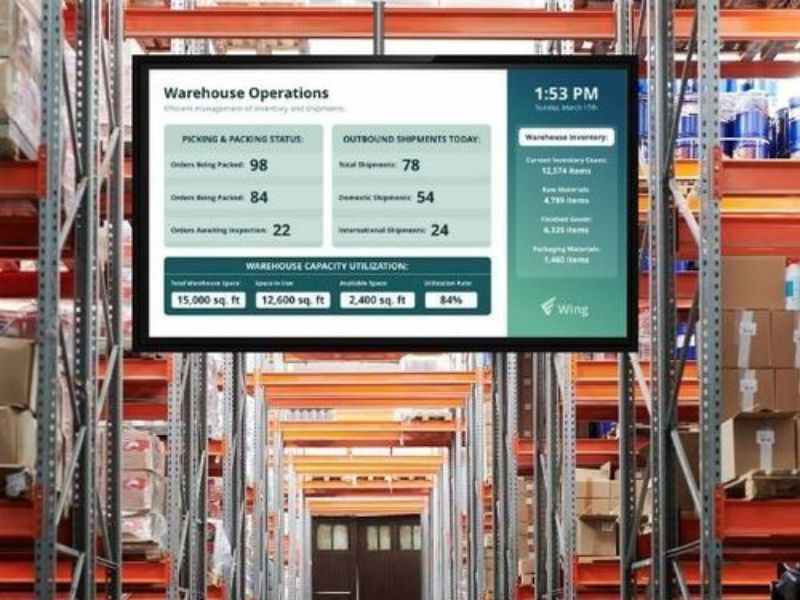
What are Digital Signage KPIs?
Key Performance Indicators (KPIs) are measurable metrics that help you understand whether your digital signage is doing its job. They tell you:
- Who is engaging with your content
- What actions they're taking (or not)
- Where bottlenecks or inefficiencies exist
Without KPIs, your screens may look great—but you won’t know if they’re helping your business.

Why do KPIs matter in Digital Signage?
Tracking KPIs allows you to:
- ✅ Optimize content based on real engagement
- ✅ Justify ROI to stakeholders
- ✅ Uncover usability or performance issues
- ✅ Improve customer and employee experiences
Think of KPIs as your signage’s report card. No grades? No improvement.
Which KPI's Should I Track?
⚠️ Tip: Not every KPI fits every screen. Choose based on display type and purpose.
How Do Customer Interactions Affect KPI Selection?
The more interactive the signage, the more dynamic the KPI strategy.
Example: A single Urgent Care waiting room might include:
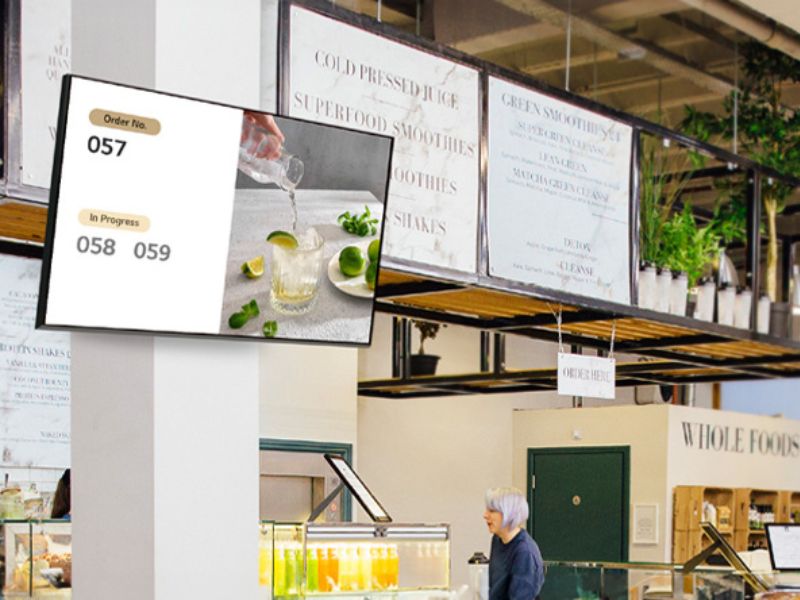
- A self-check-in kiosk → Track dwell time & session count
- A real-time waitlist display → Monitor accuracy & average wait time
- An educational slideshow → Focus on dwell time & recall rate
The goal of each screen is different—so the KPIs should be, too.
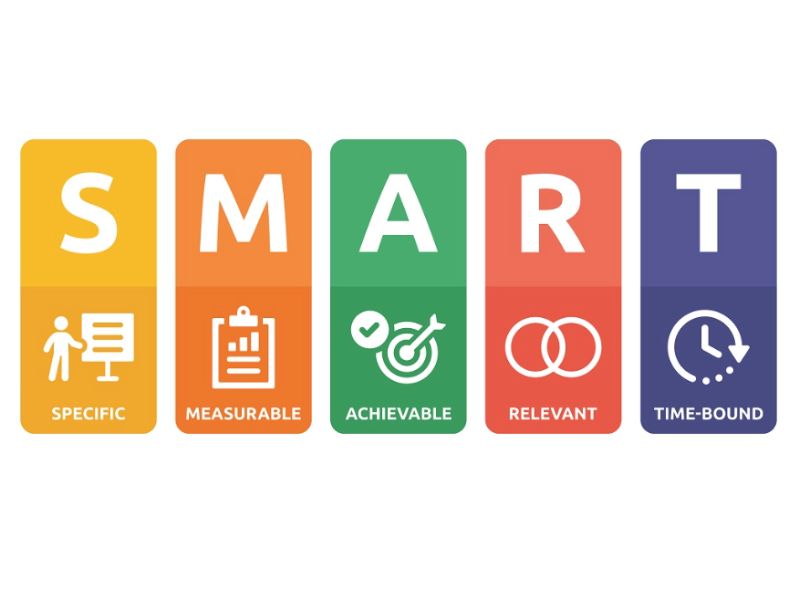
What Makes a Good KPI? (S.M.A.R.T Framework)
Use the S.M.A.R.T. method to make sure your KPIs are meaningful:
- Specific – Clearly tied to one goal
- Measurable – Quantifiable with real data
- Achievable – Realistic based on traffic and setup
- Relevant – Aligned with your display’s purpose
- Time-Bound – Tracked over a set period (daily, weekly, monthly)
❌ Bad KPI example: “Get more engagement”
✅ Good KPI example: “Increase kiosk session count by 15% this quarter”
Customer-Facing vs. Internal KPIs
🎯 Customer-Facing Metrics
Used on public-facing screens to build trust or improve transparency.
Examples:
- Real-time wait times
- NPS (Net Promoter Score)
- Website CTR or bounce rate
- Review count or social shares
Use with care: Too much transparency (like long wait times) can cause anxiety instead of reassurance.
🧩 Internal Team Metrics
Displayed inside offices or operations hubs to align teams and drive performance.
Examples:
- Cross-sell / upsell rates
- Time to Value
- Product stickiness
- Most common issue reports
- CES (Customer Effort Score)
Keep language clear, update frequently, and tie displays to team goals.
How to Set Up KPI Tracking
You don’t need to be a data scientist to get started. Here’s how:
- Define the display’s purpose (e.g., speed, awareness, engagement)
- Choose relevant KPIs using the SMART framework
- Baseline performance using historical or initial data
- Use a CMS or dashboard to automate tracking
- Analyze and optimize monthly
- Update content or UX based on trends and pain points
Final Thoughts
Digital signage can transform how businesses engage customers and teams—but only if you're tracking what matters.
By choosing the right KPIs for the right displays, you can:
- Prove ROI
- Drive better decisions
- Improve the user experience
- Avoid wasting time on meaningless metrics
🎯 The golden rule: Only track what you can act on.
Ready to turn your screens into performance machines?
Connect your signage, gather real-time data, and optimize every display.
📅 Schedule a demo with Wallboard →
.png)